Redis Inventory: Analyzing memory usage in Redis by key pattern
My name is Aleksandr, and I am an engineer and technology enthusiast based in Berlin. I work as an engineering manager. My passion is to make people’s lives easier with technology
This post is also available on medium where you can follow the author, clap for the post or comment it.
”Redis Inventory” is a tool I developed as an open-source project to practice some coding skills and also solve a very practical problem. It collects memory usage information from Redis instance (or a cluster), detects key patterns, and displays memory usage in a hierarchical way.
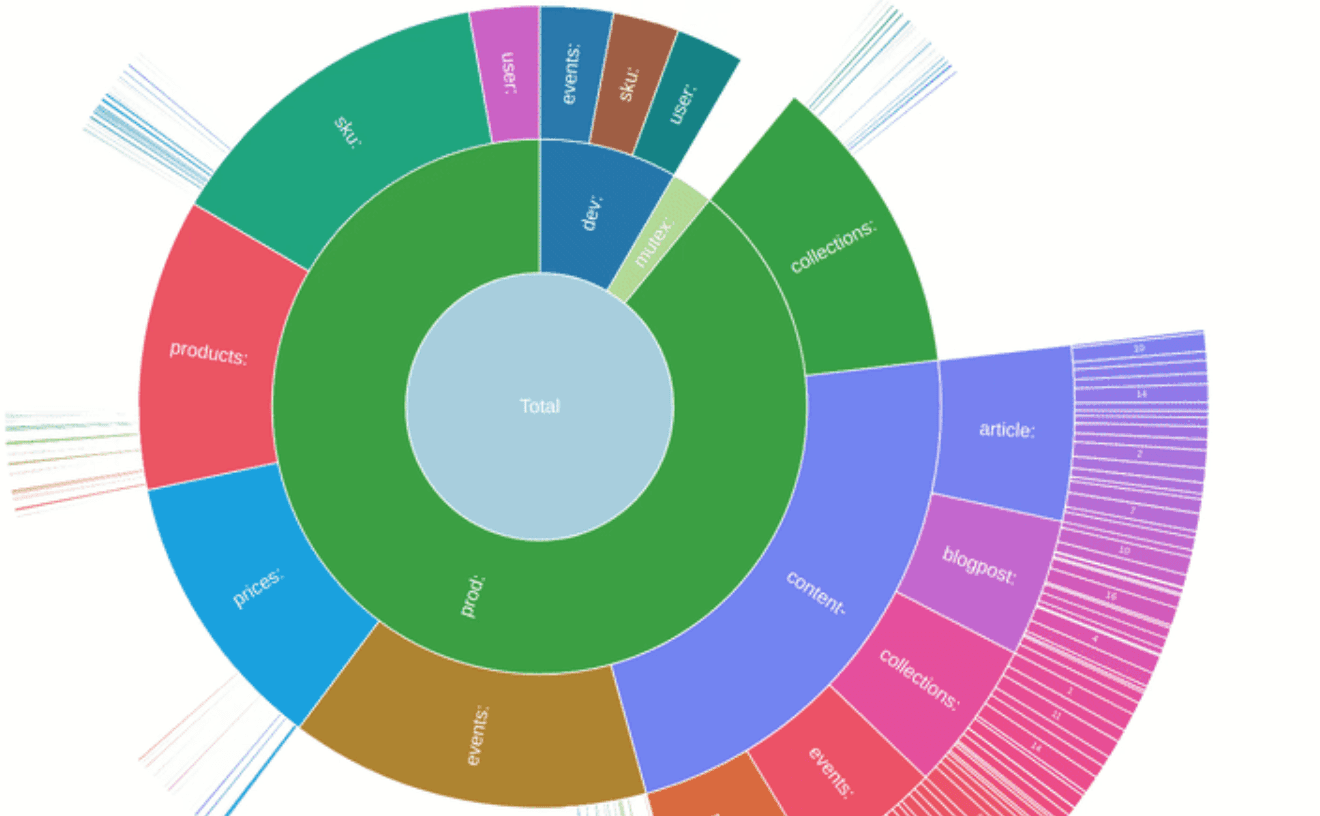
Pretty much like lots of tools helping you to clean and organize your hard drive (for example “Disk Inventory X” or Unbuntu’s “Disk Usage Analyzer”) it even visualizes usage information in a similar fashion as the latest (sunburst diagram). But there are some nuances. Let’s look closer!
So what is exactly the problem it is solving?
One can argue that, unlike hard disk, cache server is not persistent storage, so why bother analyzing its usage? Yeah, in theory, the cache is completely ephemeral and any application should be able to start and work with it in a “cold” state. But in reality, under the load, it is not always possible to flush the cache with no performance regression. Also, if there is a problem with how the app uses Redis, flushing would be only temporary mitigation as after some time the same problems will accumulate again. Sometimes, you just see general key count or memory consumption increase in Redis metrics, but it is not obvious where the problem is, so is hard to fix it in the code with no prior investigation.
The two most popular issues I’ve seen with cache were: cache key leak and forgetting to set TTLs or setting them too generously. Key leak happens when you accidentally add something too dynamic to the key, for example, timestamp or its hash. With TTLs you may rely on the application to delete them but miss that in some situations it will not happen and keys will stay in cache forever. Those issues are hard to track in big applications which are changing rapidly. Analysing all the code changes that can cause it with no hint for problematic keys can take days.
How the tool works
To analyze memory usage the tool scans keys space and measures each individual key size with MEMORY USAGE command. It builds a tree of nested nodes, similar to folder structure on your disk. But how do we interpret plain string keys as a hierarchy? It is quite common to use all sorts of prefixing in cache keys, we just need to reverse it. The simplest is to use a set of “separator” characters and break the string into a tuple of string segments.

Then treating each of these segments as a “folder” build a tree of nodes:

This data structure is known as “prefix tree” or “trie” (https://en.wikipedia.org/wiki/Trie) and there is another nice article about it I’ve used as a source when working on this project (https://medium.com/amboss/prefix-trees-in-action-404a6105b6d5). This structure is very convenient in this particular case for several reasons: it is thrifty for memory, it is easy to add keys there, and it is possible already at the stage of building it to aggregate usage data on each level. We can attach a container for aggregated metrics to each node. When adding a new key to the tree we will descend the tree and add value (memory usage or another) on each level in the path.

Except, as you may see, the “prod:” segment. But that’s ok as it does not introduce a fork in the tree and values there are inherently equal to the values of the nested “user:” segment. Once a new key will come (for example “prod:blog:1”) and the fork will be introduced we can clone the aggregator from the next nested node that has it.
Memory optimizations
This data structure is already compact and functional but sometimes caches may have thousands or millions of entities with the same prefix. In this case, we usually don’t care already about each individual entity id but rather want to stop at the level where they start branching.
For this case, maxChildren parameter is implemented. If the number of children of any particular node is greater than maxChildren value it will stop creating child nodes and just aggregate values at that level, also incrementing overflowChildrenCount counter so you can at least know how many keys are “lost”.
Rendering
Currently, there are two ways to render that data: text table and sunburst chart. The table view is displayed right in the terminal and has some formatting adjustments (see docs for more info).

The sunburst chart is rendered on an HTML page served by a built-in web server. Hovering any segment displays additional information as a tooltip. It is also zoomable: clicking on a segment makes it a central piece and renders sub-nodes around it.

“Quality of life” features
Here are some nice features that are not super necessary but can make your life easier while using this tool.
Custom separators
Not every application uses the colon as a separator for key segments. Other common separators are, for example, underscores, dashes, or dots. To use custom separators you can provide them as a single string in --separators option (i.e. --separators=":_-.". Don’t worry if some of them are not always used as separators: as you have seen, nodes with just one child do not introduce major overhead. One can even implement a completely custom segmentation strategy by implementing Splitter interface, for example, detecting numeric parts of the key and capturing them in a separate segment even if they are not padded with separator characters. This would require changing the code and building your own binary though.
Throttling
Another useful option is --throttle allowing you to specify the number of nanoseconds the tool will wait between requests to the Redis server. It may be handy if you are afraid to cause denial of service on your Redis instance.
Caching index result
As the tool supports different display formats, you may try some of them before you will find the most suitable. When using inventory command the tool will re-index the database every time. It may be time-consuming and can create unnecessary additional load for the server.
To avoid re-indexing every time instead of running inventory command you can use index command once to index Redis DB and save the index as a temp file. After that you can run display command several times with various parameters, it will use cached data and will not send any queries to the Redis server anymore. Keep in mind that options like maxChildren influence the trie structure and cannot be changed on the display step.
Open-source infrastructure
Here is the high-level overview of the project I have worked on lately. Although the main goal (except for creating the tool I needed) was to practice my skills, I’ve learned something about OSS projects infrastructure additionally. I was quite excited to know that I’m able to use a production-grade toolchain while working on this project absolutely for free:
GitHub - for version-controlled hosting my code and simplistic project management;
Travis CI - for continuous integration and delivery (uploading artifacts in docker registry);
Coveralls - to keep an eye on unit test coverage;
DockerHub - a public docker image registry for the dockerized version of the tool;
Go Report Card - for static code analysis (7 linting tools).
Not to mention open-source libraries used in the project:
Radix - a full-featured Redis client for Go,
Cobra - CLI applications framework,
Go-pretty - set of tools to render text tables and progress bars,
… and a couple of smaller ones.
Also special thanks to AnyChart for issuing a free open-source license for the project.
My point here, if you want to contribute to the open-source software world, you don’t have an excuse not to do so nowadays. It is free, convenient, and the only thing you have to invest is your time and talent. So go ahead and create the tool you lack and share it with the world.